Relazione tra condizioni meteo e contagi di COVID-19


Distribution of the SARS-CoV-2 Pandemic and Its Monthly Forecast Based on Seasonal Climate Patterns. 

Scafetta, N., 2020.
Int. J. Environ. Res. Public Health 17, 3493.
DOI: 10.3390/ijerph17103493

Nicola Scafetta

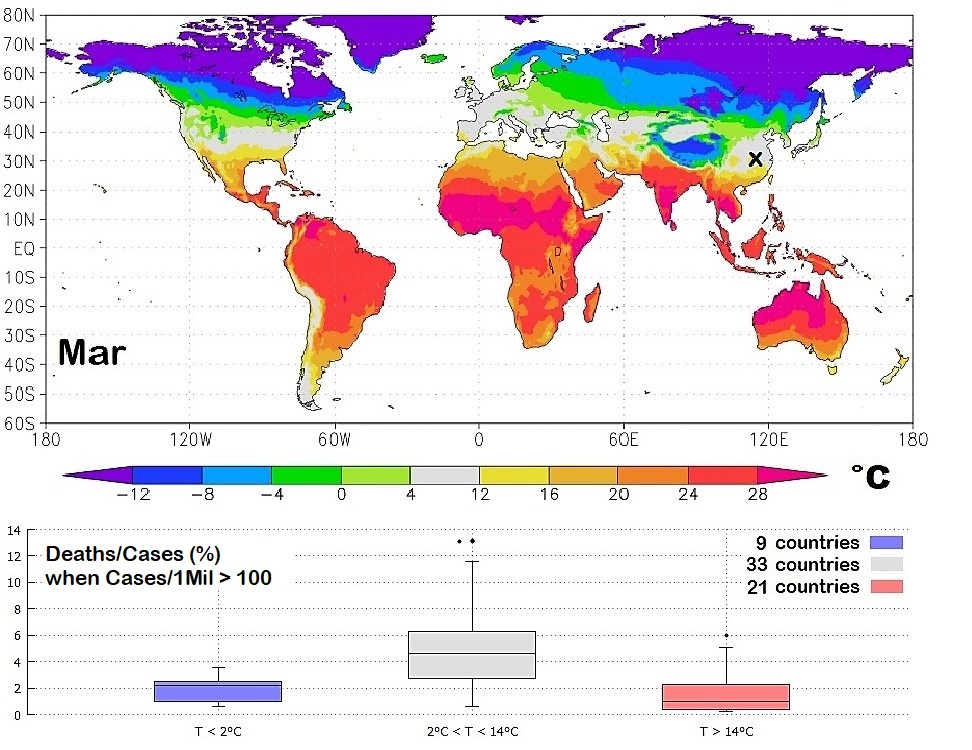
 Questo documento esamina se la pandemia CoronaVirus 2 (SARS-CoV-2) della sindrome respiratoria acuta grave avrebbe potuto essere favorita da specifiche condizioni meteorologiche e da altri fattori. Si scopre che il clima invernale del 2020 nella regione di Wuhan (Hubei, Cina centrale) - dove il virus è scoppiato per la prima volta in dicembre e si è diffuso ampiamente da gennaio a febbraio 2020 - era sorprendentemente simile a quello delle province del Nord Italia di Milano, Brescia e Bergamo, dove la pandemia è scoppiata da febbraio a marzo. L'analisi statistica è stata estesa per coprire gli Stati Uniti d'America, che hanno superato l'Italia e la Cina come il paese con il maggior numero di casi confermati di Malattia COronaVIRus 19 (COVID-19), e poi al mondo intero. I modelli di correlazione trovati suggeriscono che la letalità COVID-19 peggiora significativamente (4 volte in media) sotto le temperature atmosferiche tra i 4 e i 12 gradi centigradi e l'umidità relativa tra il 60% e l'80%. Sono stati studiati anche possibili co-fattori come l'età mediana della popolazione e l'inquinamento atmosferico, suggerendo un'importante influenza del primo, ma non dei secondi, almeno su scala sinottica. Sulla base di questi risultati, sono state generate mappe mondiali isotermiche specifiche per individuare, mese per mese, le regioni del mondo che condividono intervalli di temperatura simili. Da febbraio a marzo, la zona di isotermia di 4-12 gradi si estendeva principalmente dalla Cina centrale verso Iran, Turchia, Europa del Mediterraneo occidentale (Italia, Spagna e Francia) fino allo Stato Unito d'America, coincidendo in modo ottimale con le regioni geografiche più colpite dalla pandemia da febbraio a marzo. Si prevede che in primavera, quando il clima si alcaldo, la pandemia probabilmente peggiorerà nelle regioni settentrionali (Regno Unito, Germania, Europa orientale, Russia e Nord America) mentre la situazione probabilmente migliorerà nelle regioni meridionali (Italia e Spagna). Tuttavia, in autunno, la pandemia potrebbe tornare e colpire nuovamente le stesse regioni. La zona tropicale e l'intero emisfero meridionale, ma nelle regioni meridionali più fredde, potrebbero evitare una forte pandemia a causa del clima sufficientemente caldo durante tutto l'anno e a causa dell'età media inferiore della loro popolazione. Le mappe interattive di Google-Earth-Pro che coprono il mondo intero sono fornite come file supplementari.

https://www.unina.it/-/22121560-condizioni-meteo-climatiche-e-contagi-di-covid-19

http://www.meteoweb.eu/2020/05/coronavirus-meteo-caldo-letalita/1435300/

 
 Abstract:
This paper investigates whether the Severe Acute Respiratory Syndrome CoronaVirus 2 (SARS-CoV-2) pandemic could have been favored by specific weather conditions and other factors. It is found that the 2020 winter weather in the region of Wuhan (Hubei, Central China)—where the virus first broke out in December and spread widely from January to February 2020—was strikingly similar to that of the Northern Italian provinces of Milan, Brescia and Bergamo, where the pandemic broke out from February to March. The statistical analysis was extended to cover the United States of America, which overtook Italy and China as the country with the highest number of confirmed COronaVIrus Disease 19 (COVID-19) cases, and then to the entire world. The found correlation patterns suggest that the COVID-19 lethality significantly worsens (4 times on average) under weather temperatures between 4 °C and 12 °C and relative humidity between 60% and 80%. Possible co-factors such as median population age and air pollution were also investigated suggesting an important influence of the former but not of the latter, at least, on a synoptic scale. Based on these results, specific isotherm world maps were generated to locate, month by month, the world regions that share similar temperature ranges. From February to March, the 4–12 °C isotherm zone extended mostly from Central China toward Iran, Turkey, West-Mediterranean Europe (Italy, Spain and France) up to the United State of America, optimally coinciding with the geographic regions most affected by the pandemic from February to March. It is predicted that in the spring, as the weather gets warm, the pandemic will likely worsen in northern regions (United Kingdom, Germany, East Europe, Russia and North America) while the situation will likely improve in the southern regions (Italy and Spain). However, in autumn, the pandemic could come back and affect the same regions again. The Tropical Zone and the entire Southern Hemisphere, but in restricted colder southern regions, could avoid a strong pandemic because of the sufficiently warm weather during the entire year and because of the lower median age of their population. Google-Earth-Pro interactive-maps covering the entire world are provided as supplementary files.
 
 
Supplement to “Distribution of the SARS-CoV-2 Pandemic and Its Monthly Forecast Based on Seasonal Climate Patterns.”
The online Supplement File provides the same twelve isotherm maps shown in Figures 11, 12, 13 e 14 shown in the main paper for each month of the year from January to December as Keyhole Markup language Zipped (kmz) files, that is, as Climate Explorer Google-Earth-Pro interactive and zoomable maps.
 
Supplementary Materials
The following are available online at https://www.mdpi.com/1660-4601/17/10/3493/s1.
 

Stampa  

DOVE SIAMO

Complesso Universitario
di Monte Sant'Angelo (Ed. 10)
Via Vicinale Cupa Cintia 21
80126 NAPOLI
Trovaci su Google Map
 

TROVACI!

mappa per DISTAR
 

RIFERIMENTI

Università degli Studi di Napoli Federico II  
Dipartimento di Scienze della Terra, dell'Ambiente e delle Risorse
Osservatorio Meteorologico "San Marcellino"
Responsabile Scientifico: Prof. Nicola Scafetta
Responsabile Tecnico: Dr Raffaele Viola